

SentivexNETOPS
Sentivex NetOps
Infrastructure monitoring and failure-prediction platform
It integrates without changing your existing monitoring setup.
It takes the data your network monitoring (NMS) and security log (SIEM) systems
have already gathered, as it is.
Rather than waiting on alarms, it catches anomalies before they surface.
Why NetOps
More to manage, the same way of managing it
Infrastructure monitoring as it stands today
- Each vendor has its own management screen, so monitoring means moving between consoles.
- Device status, configuration, and replacement timing are each managed in a different system.
- Response starts only after an alarm goes off, and there is no basis for choosing what to service preventively.
- Operational reports and audit material are compiled by hand every time.
How NetOps does it
- You don't replace your existing equipment. It takes the data your NMS and SIEM already collect as-is, and collects directly only where there is a gap.
- Different vendors, one screen. Adding equipment doesn't mean rebuilding your screens, searches, and reports.
- It catches failures before they happen. It shows the risk evidence, the deadline for acting, and how often that judgment has been right in the past.
Core Features
Core capabilities
Connector-based collection
Supports 142 vendors and 22 collection paths.
Pull from the NMS and SIEM you already run, use the vendor's API, or collect directly over the protocol.
One device can use several paths at once — inventory from the controller, performance over SNMP, events over syslog.
Infrastructure operations console
Organized into eight areas: monitoring, assets, performance, incidents, prediction, AI, integration, and administration.
Open a single device and everything related to it is on one screen.
Live status is filled in by the collectors; contracts, warranties, and owners are registered by hand.
Failure prediction
Continuously watches risk signals across nine categories, including temperature, power, fans, optical signal, and resource usage.
No scores or grades are shown. Only the priority, the basis for the judgment, and the raw observations.
Device safety levels
Each connector states exactly how far it reaches into a device, across six levels.
They range from read-only to levels that execute only after a person approves, and the customer sets what is permitted.
The existing configuration is saved before any change, and restored automatically if the change fails.
Live Screens
The screens exactly as they run
Monitored targets, outages, warnings, and predictive alarms sit along the top, with live events and regional status gathered on one screen.
If collection stops the alarms stop too, so collection status is on the same screen.
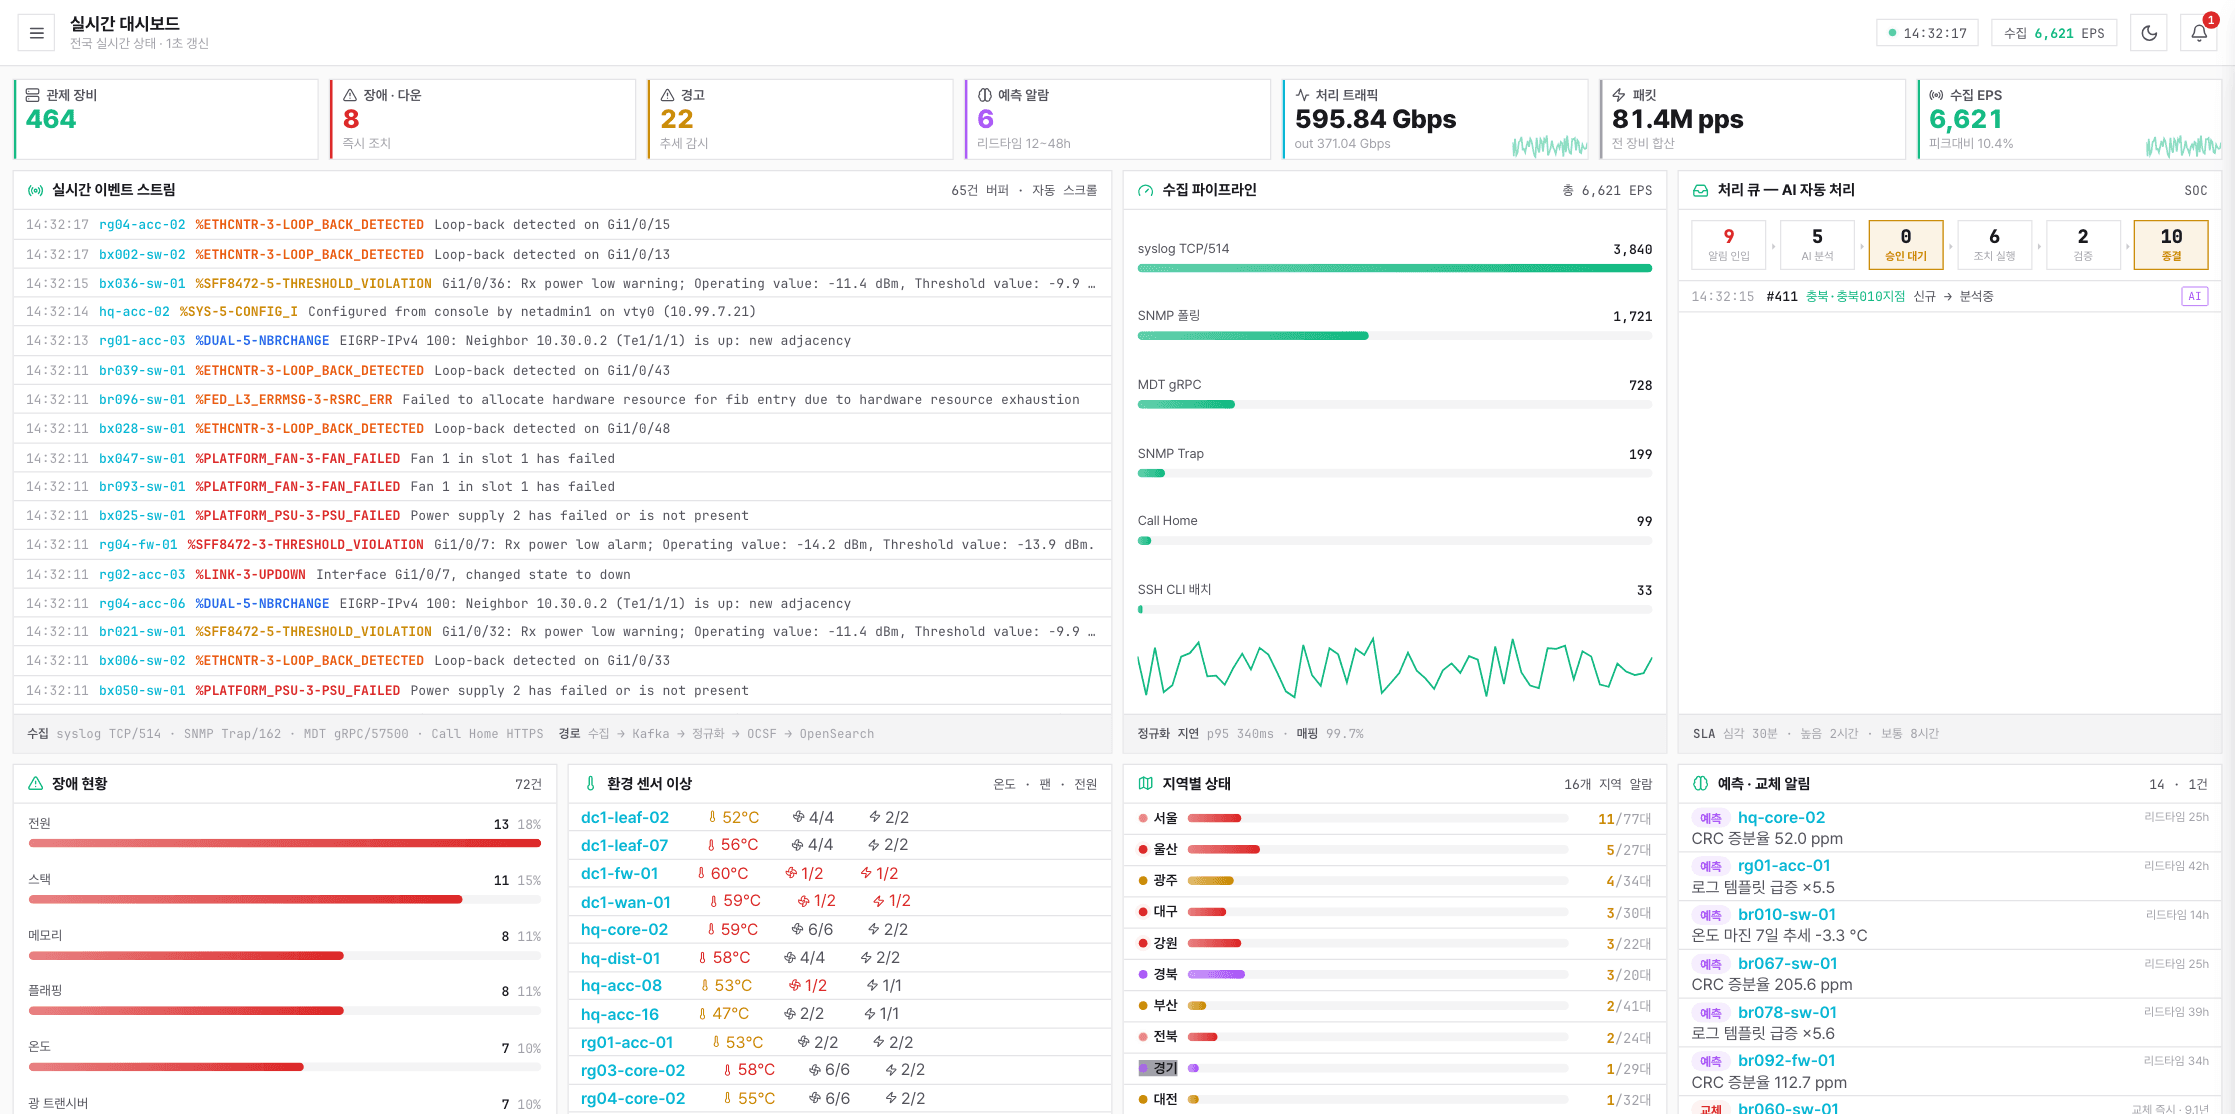
It runs from the monitoring map and topology through assets, prediction, incident handling, and reports. Click a screen to enlarge it.
Evaluation and integration design
We go through the NMS, SIEM, and ITSM you run today and agree on the scope of integration.
It runs alongside your existing monitoring without changing device configuration, and cuts false positives.